


Task Overview
Task Overview
In the PMS (Project Management System) task view, users have the flexibility to choose from four different types of views to display and interact with their tasks. Each view offers a unique perspective and layout for managing and tracking tasks. Here is a description of the four types of views available
- List view
- Kanban view
- Calendar view
- Gantt view
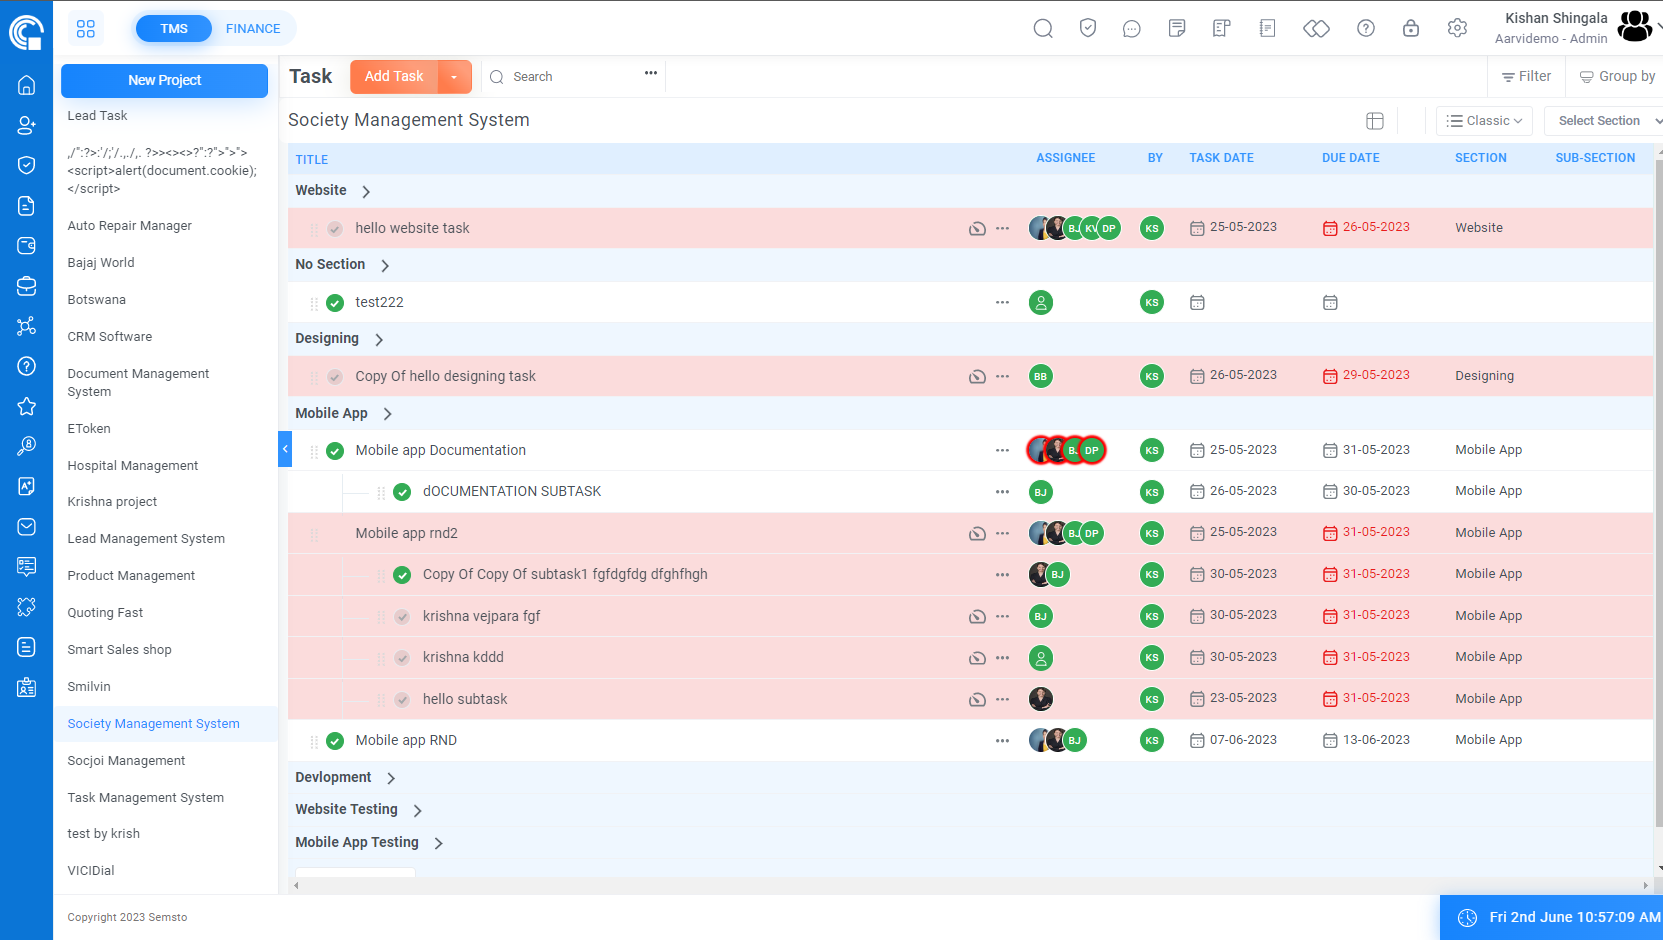
- List view
- The List View provides a tabular representation of tasks, allowing users to view task details in a structured format.
- Tasks are displayed in rows, with columns displaying attributes such as task name, assigned user, status, priority, and due dates.
- Users can sort and filter tasks based on different criteria, making it easier to find and prioritize specific tasks.
- List View is ideal for users who prefer a more structured and organized way of managing tasks.

- Kanban view
- The Kanban view is based on the Kanban board methodology, where tasks are represented as cards on a board.
- The board is divided into columns representing different stages or status categories (e.g., To Do, In Progress, and Completed).
- Users can drag and drop tasks between columns to update their status or progress.
- Kanban view provides a visual representation of task workflow and enables users to track the progress of tasks at a glance.
- It is particularly useful for teams who prefer a visual approach to task management and agile project management methodologies.

- Calendar View:
- The Calendar view displays tasks in a calendar format, allowing users to view tasks based on their due dates.
- Tasks are represented as events or appointments on the calendar, with their respective due dates and durations.
- Users can navigate through different dates and view tasks for specific time periods.
- Calendar view provides a convenient way to manage tasks with time-sensitive deadlines and schedule workload effectively.

- Gantt View
- The Gantt view presents tasks in a horizontal bar chart, known as a Gantt chart.
- Each task is represented as a bar that spans the timeline, indicating its start date, end date, and duration.
- Each task is represented as a bar that spans the timeline, indicating its start date, end date, and duration.
- Gantt view allows for efficient scheduling, resource allocation, and tracking of task progress over time.
- It is particularly useful for managing complex projects with interdependent tasks and tracking project timelines.